1.6 Export of results
All results that are generated, i.e. statistics/tables, regression results and graphs, can be exported and used in other tools. The most common tools for editing and processing numbers are Excel and Google Sheets, but you can also export results into text documents. Graphs can be edited in image processing software, such as Paint, or in the web based editor Vega.
Export is done by holding the mouse pointer over the relevant statistic/analysis result or graph. A button will then appear which you can press and which will open a menu that gives you various choices based on whether you are going to export numbers/statistics or graphs.
-
Statistics/tables/regression result:
For statistics/analysis results, you can choose to use Norwegian comma punctuation by checking this option.
You can also choose to export in semi-colon separated format and/or with a limited number of decimal places.
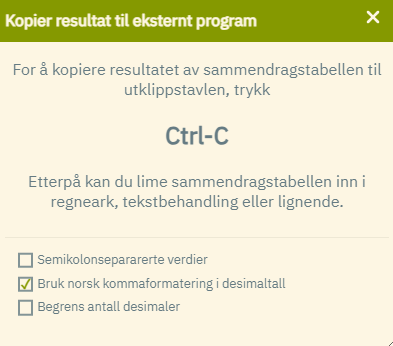
After selecting export options, use the key combination CTRL + C to copy the statistics. Finally, open a spreadsheet or a text document, and paste (CTRL + V or right-click and select "Paste").
Note that numbers will be displayed with all decimals when exporting numbers into a spreadsheet (numbers displayed in microdata.no do not show all decimals).
Note: It is also possible to export all statistics and analysis results in one operation (figures are not copied). This is done by clicking on this button at the top right, and then "Kopier til utklippstavlen" ("Copy to clipboard"):

You can also choose to print all results that you find in the results window on the right after running the script, possibly save as .pdf, when you select "Skriv ut" ("Print").
-
Graphs:
For graphs, you can choose to download as an image file in various image formats (.png (standard image format) and .svg (Scalable Vector Graphics - a standard file format for displaying two-dimensional images that allows you to scale up the display as much as you want without loss of resolution)) or to open the graph in a web-based graph editor (Vega) where you can make adjustments to the appearance of the graph (change labels, colours etc.).
If you have chosen to open a graph in the Vega editor, you are automatically sent to a web page and can save the result there after editing is complete. You then have the option to save the result as .png, .json, .svg, .pdf and .html.
Note that graphs are exported as images, and the underlying figures cannot be included in the export.
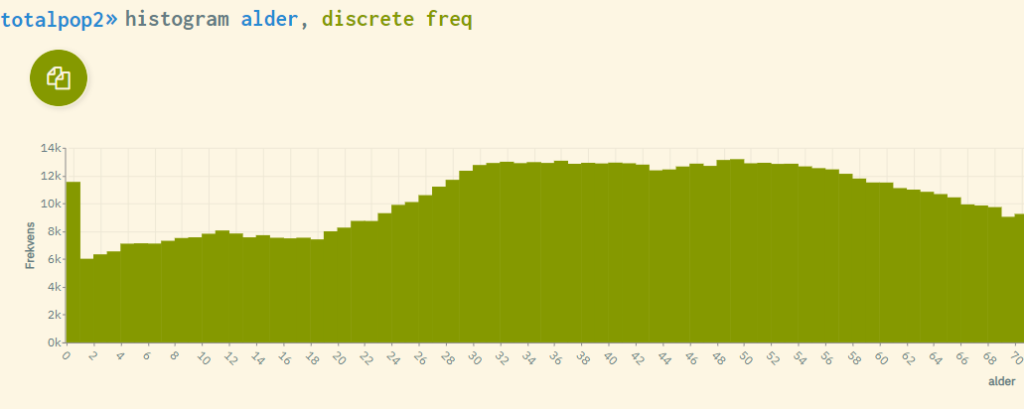 Hold the mouse pointer over the graph and click the export button
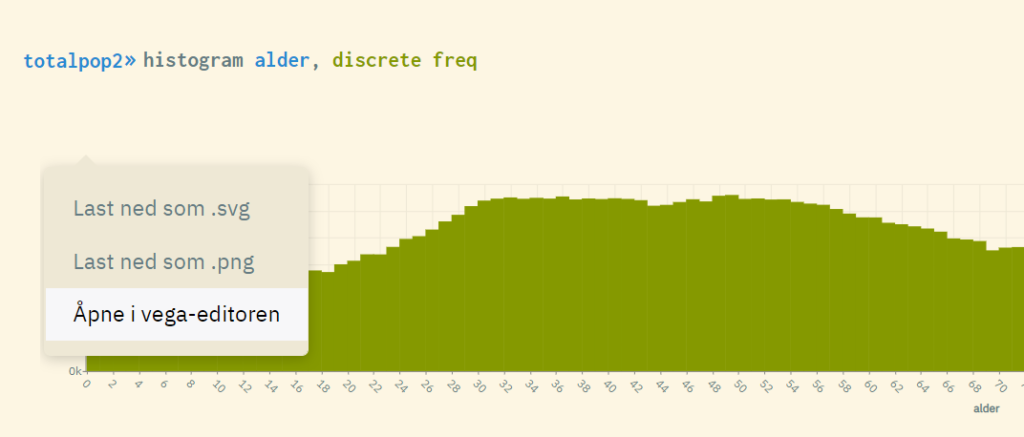 More options when exporting a graph
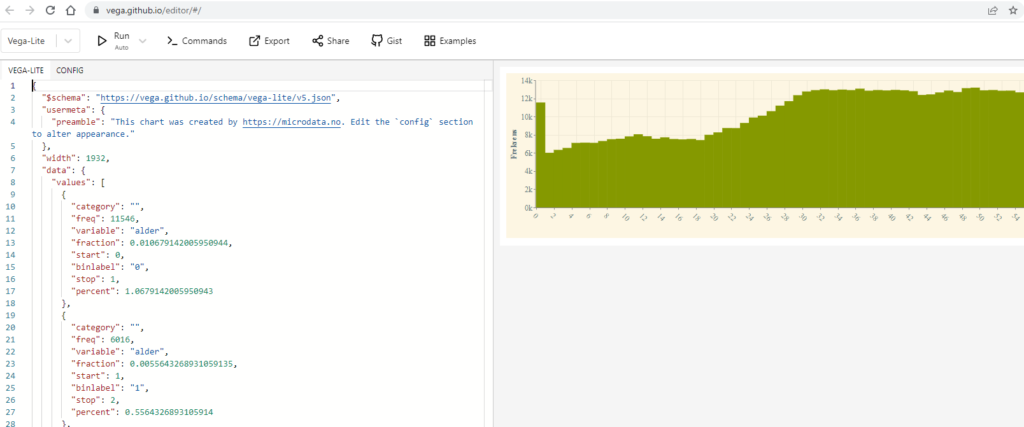 Editing of graphs in Vega editor. You edit in Vega by adjusting the various values in the left window, then clicking on the "Run" button at the top. The graph is then drawn again with the new settings. Finally, the graph can be saved by clicking the "Export" button.